


Top lines
- In 2025/26, businesses paid £344.8bn in taxes, with Corporation Tax and Employers’ National Insurance Contributions (NICs) alone representing almost two-thirds (65.6%) of the total tax burden of businesses.
- The share of the tax burden on businesses has steadily increased since 2019/20 - reaching 31.3% in 2025/26, the highest since at least 1998/99 on a like-for-like basis.
- Business taxes in recent years have grown more quickly than the overall tax revenue, with the widening gap showing that businesses are shouldering a disproportionate share of the tax growth. In 2025/26, businesses paid 12.7% more in taxes compared to the previous year, outstripping growth in overall tax revenues (8.9%).
- As expected after the 2024 Autumn Budget, Employers NICs has become the biggest tax on businesses, overtaking Corporation Tax – it cost businesses £123.1bn in 2025/26, a 27.6% increase compared to 2024/25, and accounted for 35.7% of the total business tax burden.
- Since 2020, the introduction of new taxes such as the Plastic Packaging Tax, the Energy Profits Levy, the Residential Property Developer Tax, and the Bank of England Levy have compounded the pressure on businesses, adding £3.6bn more to the burden.
Methodology
Our primary source of data was the ONS’s monthly public sector receipts data . This dataset provides a monthly revenue figure for each type of income. From this, we filtered out the non-business-related revenues.
After filtering out non-relevant taxes, we needed to determine the share of each tax paid by businesses. If only businesses pay a specific tax, the share is 100%. This consists of revenues such as corporation tax, business rates, registration tax, etc. In some cases, however, we needed to estimate a specific share. We explain our methodology for key taxes below:
- Social contributions (includes NICs): we excluded employees’ NICs as that tax is paid by employees. We also excluded the share of Employers NICs paid by the public sector. We used the HMRC’s yearly tax receipt dataset for scaling.
- Income tax paid through self-assessment: Income tax paid on sole traders' profits from self-employment is considered a business tax. We estimated their contribution from government data on personal income statistics . The dataset provides the number of self-employed by income range, and the mean of each range’s income.
- VAT: Where the goods or services offered by a company are VAT exempt, VAT is not charged to customers. This is the case for many financial services activities, so these companies cannot recover their input VAT, leading to irrecoverable VAT. We used the PwC’s report on the total tax contribution of financial services in 2023 , and used their irrecoverable VAT paid as a proxy. For 2024/25 (and for 2025/26), we used the PwC’s report on the banking sector and scaled accordingly. While this is a slight underestimate as it excludes any irrecoverable VAT paid by non-financial businesses, the rest of the economy is not exposed to the same extent, or at all, to irrecoverable VAT.
- Other taxes such as fuel duties, Insurance Premium Tax, Stamp Duty Land Tax, etc., were also estimated in a similar manner. We also excluded public sector employers to only account for private sector contributions. This is relevant to taxes such as the Apprenticeship Levy.
Results
Businesses in the UK continue to contribute significantly towards government revenues. This analysis shows that businesses paid £344.8bn in taxes in 2025/26, a 31.3% contribution to total tax revenues.
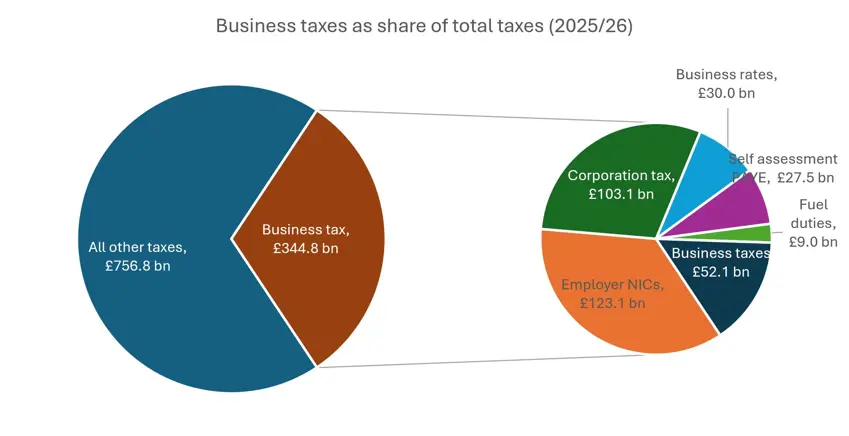
Chart 1: Business tax contribution composition, 2025/26
Corporation Tax and Employer NICs together make up 65.6% of the total tax businesses pay, representing over £226bn in tax receipts for the Government. The next largest category is Business Rates, accounting for 8.7% of total taxes paid by businesses.
On top of the traditional business taxes, business pay a suite of “other” taxes. Together, these smaller taxes add up to £52.1bn, or 15.1% of all taxes business pays. Environmental levies, irrecoverable VAT and Insurance Premium Tax make up more than 41% of this category, with the remainder coming from over 20 other business taxes. Since 2020, new taxes such as the Plastic Packaging Tax and the Energy Profits Levy have added £3.6bn more to the burden. Business paid 12.7% (£38.8bn) more in taxes in 2025/26 compared to 2024/25, outstripping growth in overall tax revenues (8.9%, or £90.3bn).
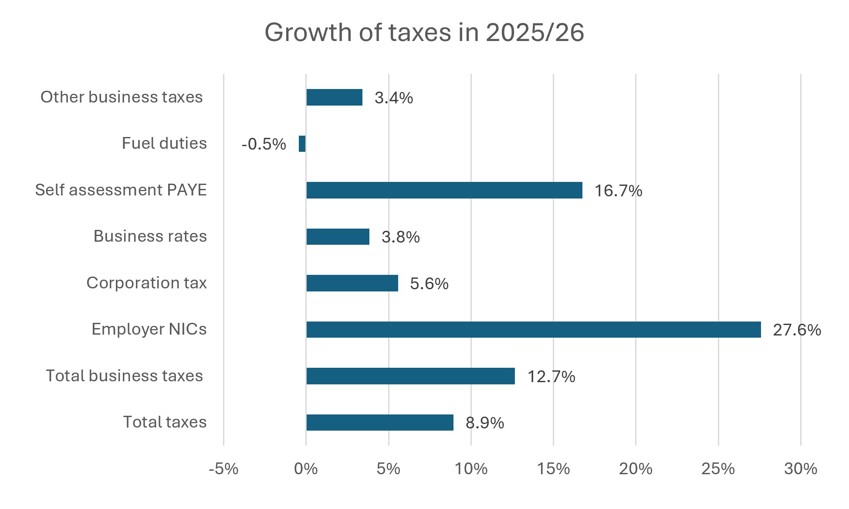
Chart 2: Growth in tax revenues between 2024/25 and 2025/26
Overall, all business taxes except for fuel duties saw an increase relative to last year. The increase in the rate of Employer NICs and reduction in thresholds has added to the already high cumulative burden faced by business. Employer NICs tax receipts have been increasing, a trend we have seen over the past decade. Compared to the year before, Employer NICs receipts have increased by 27.6%, 11 percentage points higher than the tax with the second biggest increase (self-assessed PAYEs, 16.7%). Most of this increase is driven by three government policy decisions all effective from April 2025: an increase in the Employer NICs rate from 13.8% to 15%, a drop in the Employer NICs threshold from £9,100 annual equivalent to £5,000, and above inflation increases in the private sector wage bill, partly driven by a 6.7% increase in the rate of the National Living Wage.
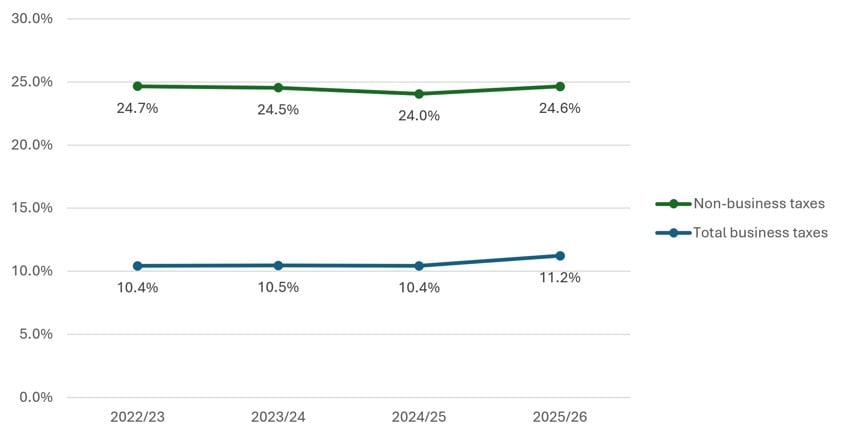
Chart 3: Business tax as a share of GDP
2025/26 saw the business tax burden as a percentage of GDP increase to 11.2%, with this figure having remained steady at 10.4% since 2022/23. Having fallen in 2024/25, non-business taxes as a share of GDP increased in 2024/25 - reaching 24.6%. Businesses are now managing a greater share of the tax burden compared to previous years.
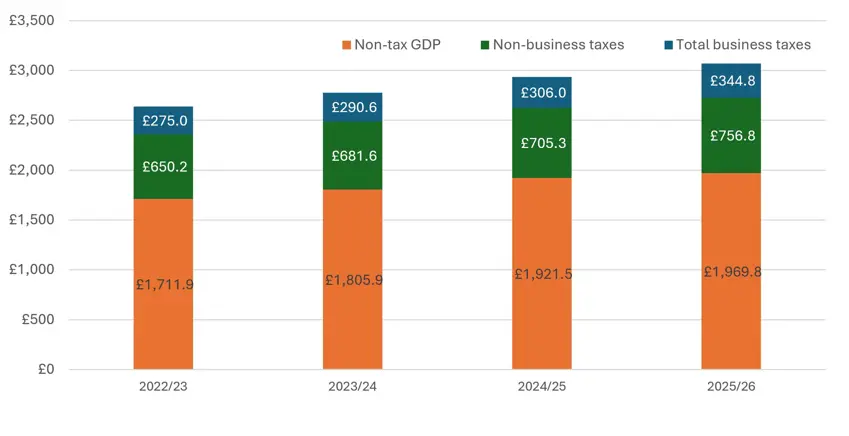
Chart 4: GDP broken down by non-tax, non-business tax, and business tax, £ bn
Next steps
Our analysis provides valuable insights into the tax burden faced by businesses at a high level, but there is scope for more in-depth analysis. We will continue to produce this analysis on an annual basis and currently seeking a partner or sponsorship to support this.
As part of our future work, we aim to examine sector-specific tax impacts and assess how the tax burden impacts businesses of different sizes. These insights will help inform more targeted and effective policy recommendations.
If you are interested in learning more or exploring potential collaboration opportunities, please contact Mohammad Jamei, CBI Director of Economic Policy.